Filtering and Assembly
Overview
Teaching: 20 min
Exercises: 30 minQuestions
How do I assemble my genome?
How do I asses my assembly result?
Objectives
Getting familiar with assembly tools and use them to assemble a genome
Switching history & using template workflow
If you cannot find
27255_raw_2021history, you can also reuse other histories that already has thebarcode02.fastq.gzdata.
We will go back to use the raw data from the 27255_raw_2021 history to assemble the sample file barcode02.fastq:
- On the history panel, click the second icon from the left (
view all histories) - Find the
27255_raw_2021historywhich contains the raw read data, and clickSwitch to. Note that the history will move to the left as theCurrent History.
We have prepared the next workflow for you:
- In a new tab, open this link: https://usegalaxy.eu/u/matinnu/w/02assembly
- On the top-right corner, click the
+button (import workflow) - Click
startusing this workflow - Click on the name of the newly imported workflow (
imported: 02_Assembly) and clickEdit - Explore the workflow and make changes if necessary
Running the workflow
When you are contempt with the workflow, run it by:
- Click the “play” button on the top-right corner (
Run Workflow) - If the workflow does not show in detailed view, click
Expand to full workflow form - Set
Send results to a new historytoyes. - Change the history name to “01_Assembly_2021_sample02”.
- On the
1: input dataset, select2: barcode02.fastqas the input. - Click
Run Workflowon the top panel.
While we are waiting for the results, lets take an overview of each processes.
Trimming and Filtering Reads
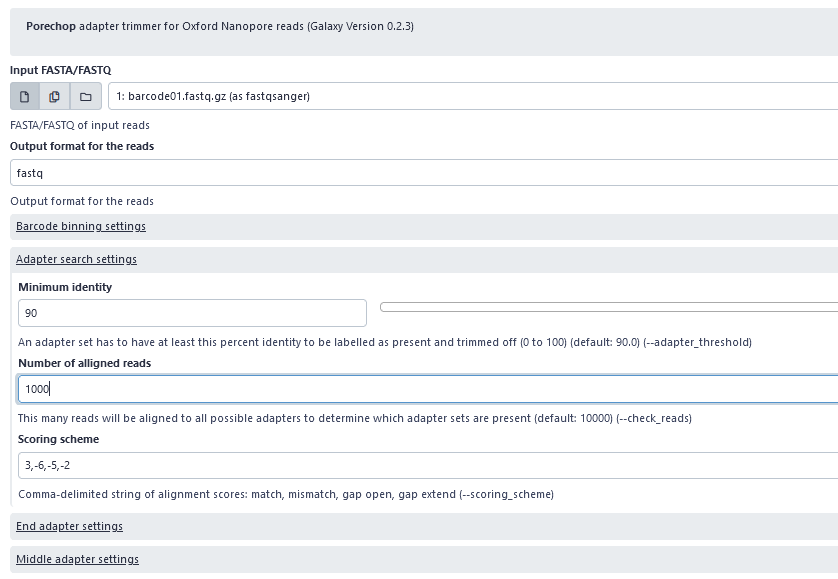
Porechop: Adapter removal from raw nanopore reads
In order for the DNA to attach and translocate the nanopore and thereby enable sequencing, we add adapters to both fragments of our DNA (template and complement strand) in the library preparation step. Following sequencing, the adapters need to be removed from the raw sequencing data before further processing, as they are synthetic sequences. In the workflow, we will use Porechop with default setting to remove adaptors from the nanopore raw reads. If Porechop is running too slow, we can also use alternative programs such as cutadapt or trimmomatic.

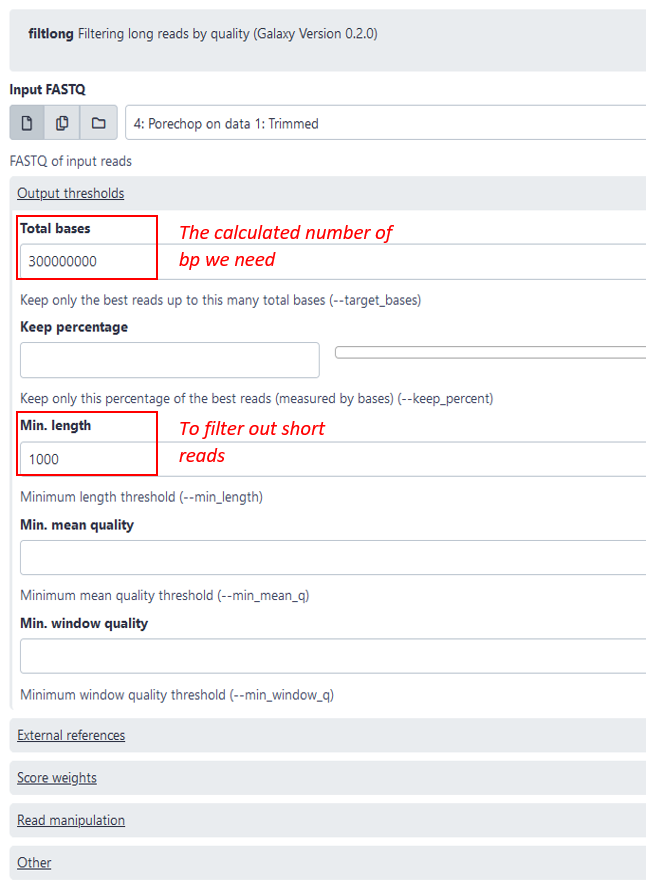
Filtlong: Trimming short and bad quality reads
As a next step you are recommend subsetting and reducing the dataset with filtlong. This is not strictly necessary, but it will reduce the running time of the following steps and usually an average genome coverage of over 50 does not significantly improve the assembly in our experience. The coverage is defined by the number of reads that cover a given nucleotide. The genome coverage can be calculated by (number of total bp in reads)(genome length in bp) or alternatively (number of reads)(average read length in bp)*(genome length in bp). So to calculate the number of bp we need for a genome coverage of 50, we simply multiply the estimated genome size by 50, for example: 5 000 000 * 50 = 250 000 000. To be sure we can take 300 000 000 bp, which we then put in the setting “total bases” see image blow. Additionally, it is recommended to filter out shorter reads (<1000bp), since they are not helpful for the assembly.

Compare Raw vs Filtered Nanoplot Stats
We can get an overview of how our reads looked like after the filtering process by comparing the filtered with the raw Nanoplot stats.
Discussion 01
- How much bp are discarded? Do you see a significant amount of data loss?
- How does the quality of the data changed? Do you see increased N50 and read quality?
Solution
TBD
Assembly & Polishing
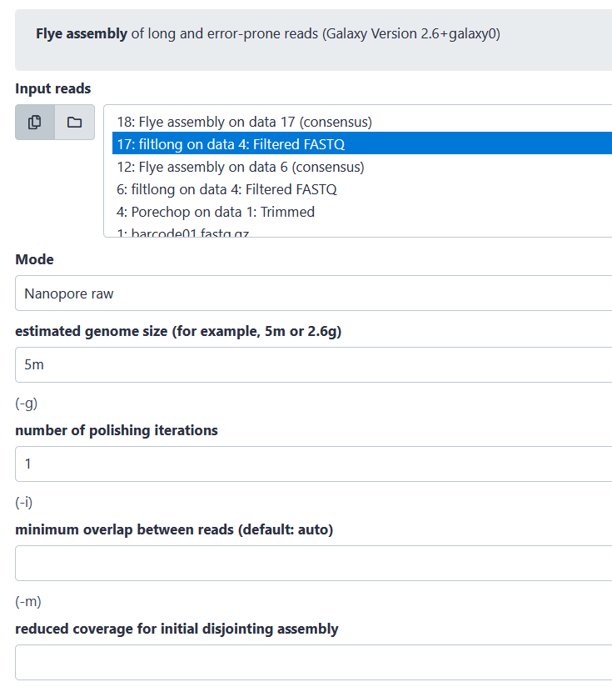
Flye: Assembling long-reads into whole genome
There is a wide range of different assembly tools, and you are free to choose which one you use. However, we advise you to consider the advantages and disadvantages of the tool you apply. Below, Flye was used as an example for the assembly of the trimmed and subsetted reads. Flye has been shown to have a high contig contiguity and accuracy, however it needs a lot or RAM usage and has a longer run time. So, if it runs to slow consider using a different assembly tool.

Quality check of assembly
After the assembly has finished running, we again need to check the quality. For that we can use three different measurements. We can first look at the assembly stats and the assembly graph.
Discussion 02 - Assembly stats
Open the “assembly_info” (see image) of flye.
- What is the length of the assembly? Is it close to the estimated genome size?
- How many contigs do we have?
- What is the coverage of each contigs? Is it sufficient?
Solution
Discussion 03 - Assembly Graph Visualization with Bandage
For visualizing our assembly, we used the tool “Bandage image” with the default settings.
- Look at the contigs visualization. How does your assembly graph looks like? Simple or tangled? Do you expect a circular or linear genome?
- Can you spot the plasmids? What do you expect of a plasmid’s coverage compared to that of a genome?
Solution
Ideally, all reads are assembled into one genome (example 1), but the fewer pieces (=contigs) the assembly has, the better. Ideally these should also appear circular, as this illustrates a fit of all the reads into an entire genome. However, small contigs (as in example 2) could be plasmids, but could also have resulted from repeats in the genome, which could not be resolved by the assembler.
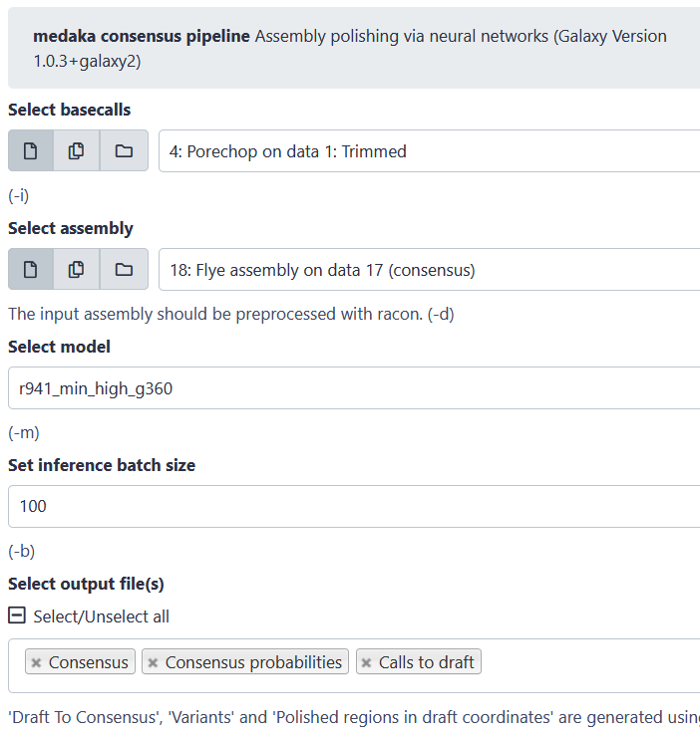
Medaka: Polising with Nanopore reads
For polishing there are again several tools available. Be aware that some assembly pipelines already have the polishing included, while others don’t. Also, some polishing tools work better with specific assemblers. For the polishing example below, we applied the tool “medaka”, using the complete set of trimmed reads to polish our assembly. To check if the polished assembly has actually been improved compared to the unpolished assembly, we can again perform all the steps from (2).

Key Points
Before assembling a genome, make sure to do a proper filtering and trimming to achieve the best assembly possible. There are various algorithm and tools to assemble and polish your genome. Decide which one suits your need.
You can do a sanity check of your assembly by using prior knowledge such as: (1) expected genome size, (2) expected structure of the genome (circular or linear), (3) compare contigs length and depth distribution, and (4) make sense of the assembly graph. From this information, you can decide whether you need to add more depths (by re-sequencing) or do another run if the result is too fragmented.
